Marketing strategist and analyst — turning messy ideas into meaningful, data-driven insights.
About Me
Marketing strategist and analyst — turning messy ideas into meaningful, data-driven insights.
About Me
My Work
About


Networking… but with fish.
No explanation, just vibes.
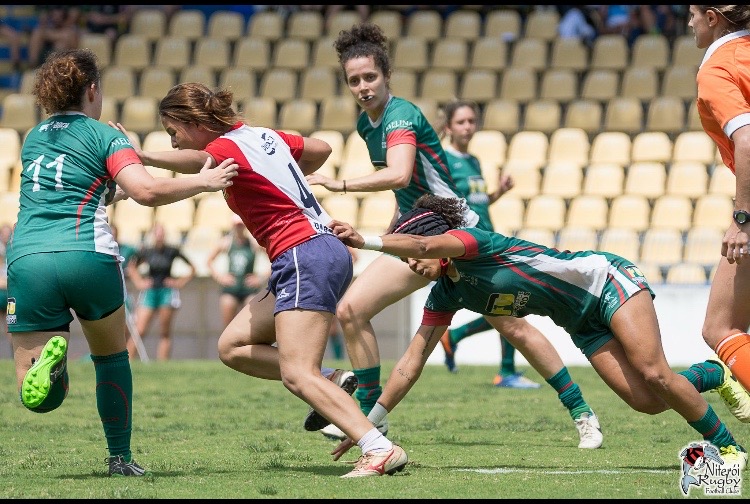
I tackle problems the same way I tackle people.
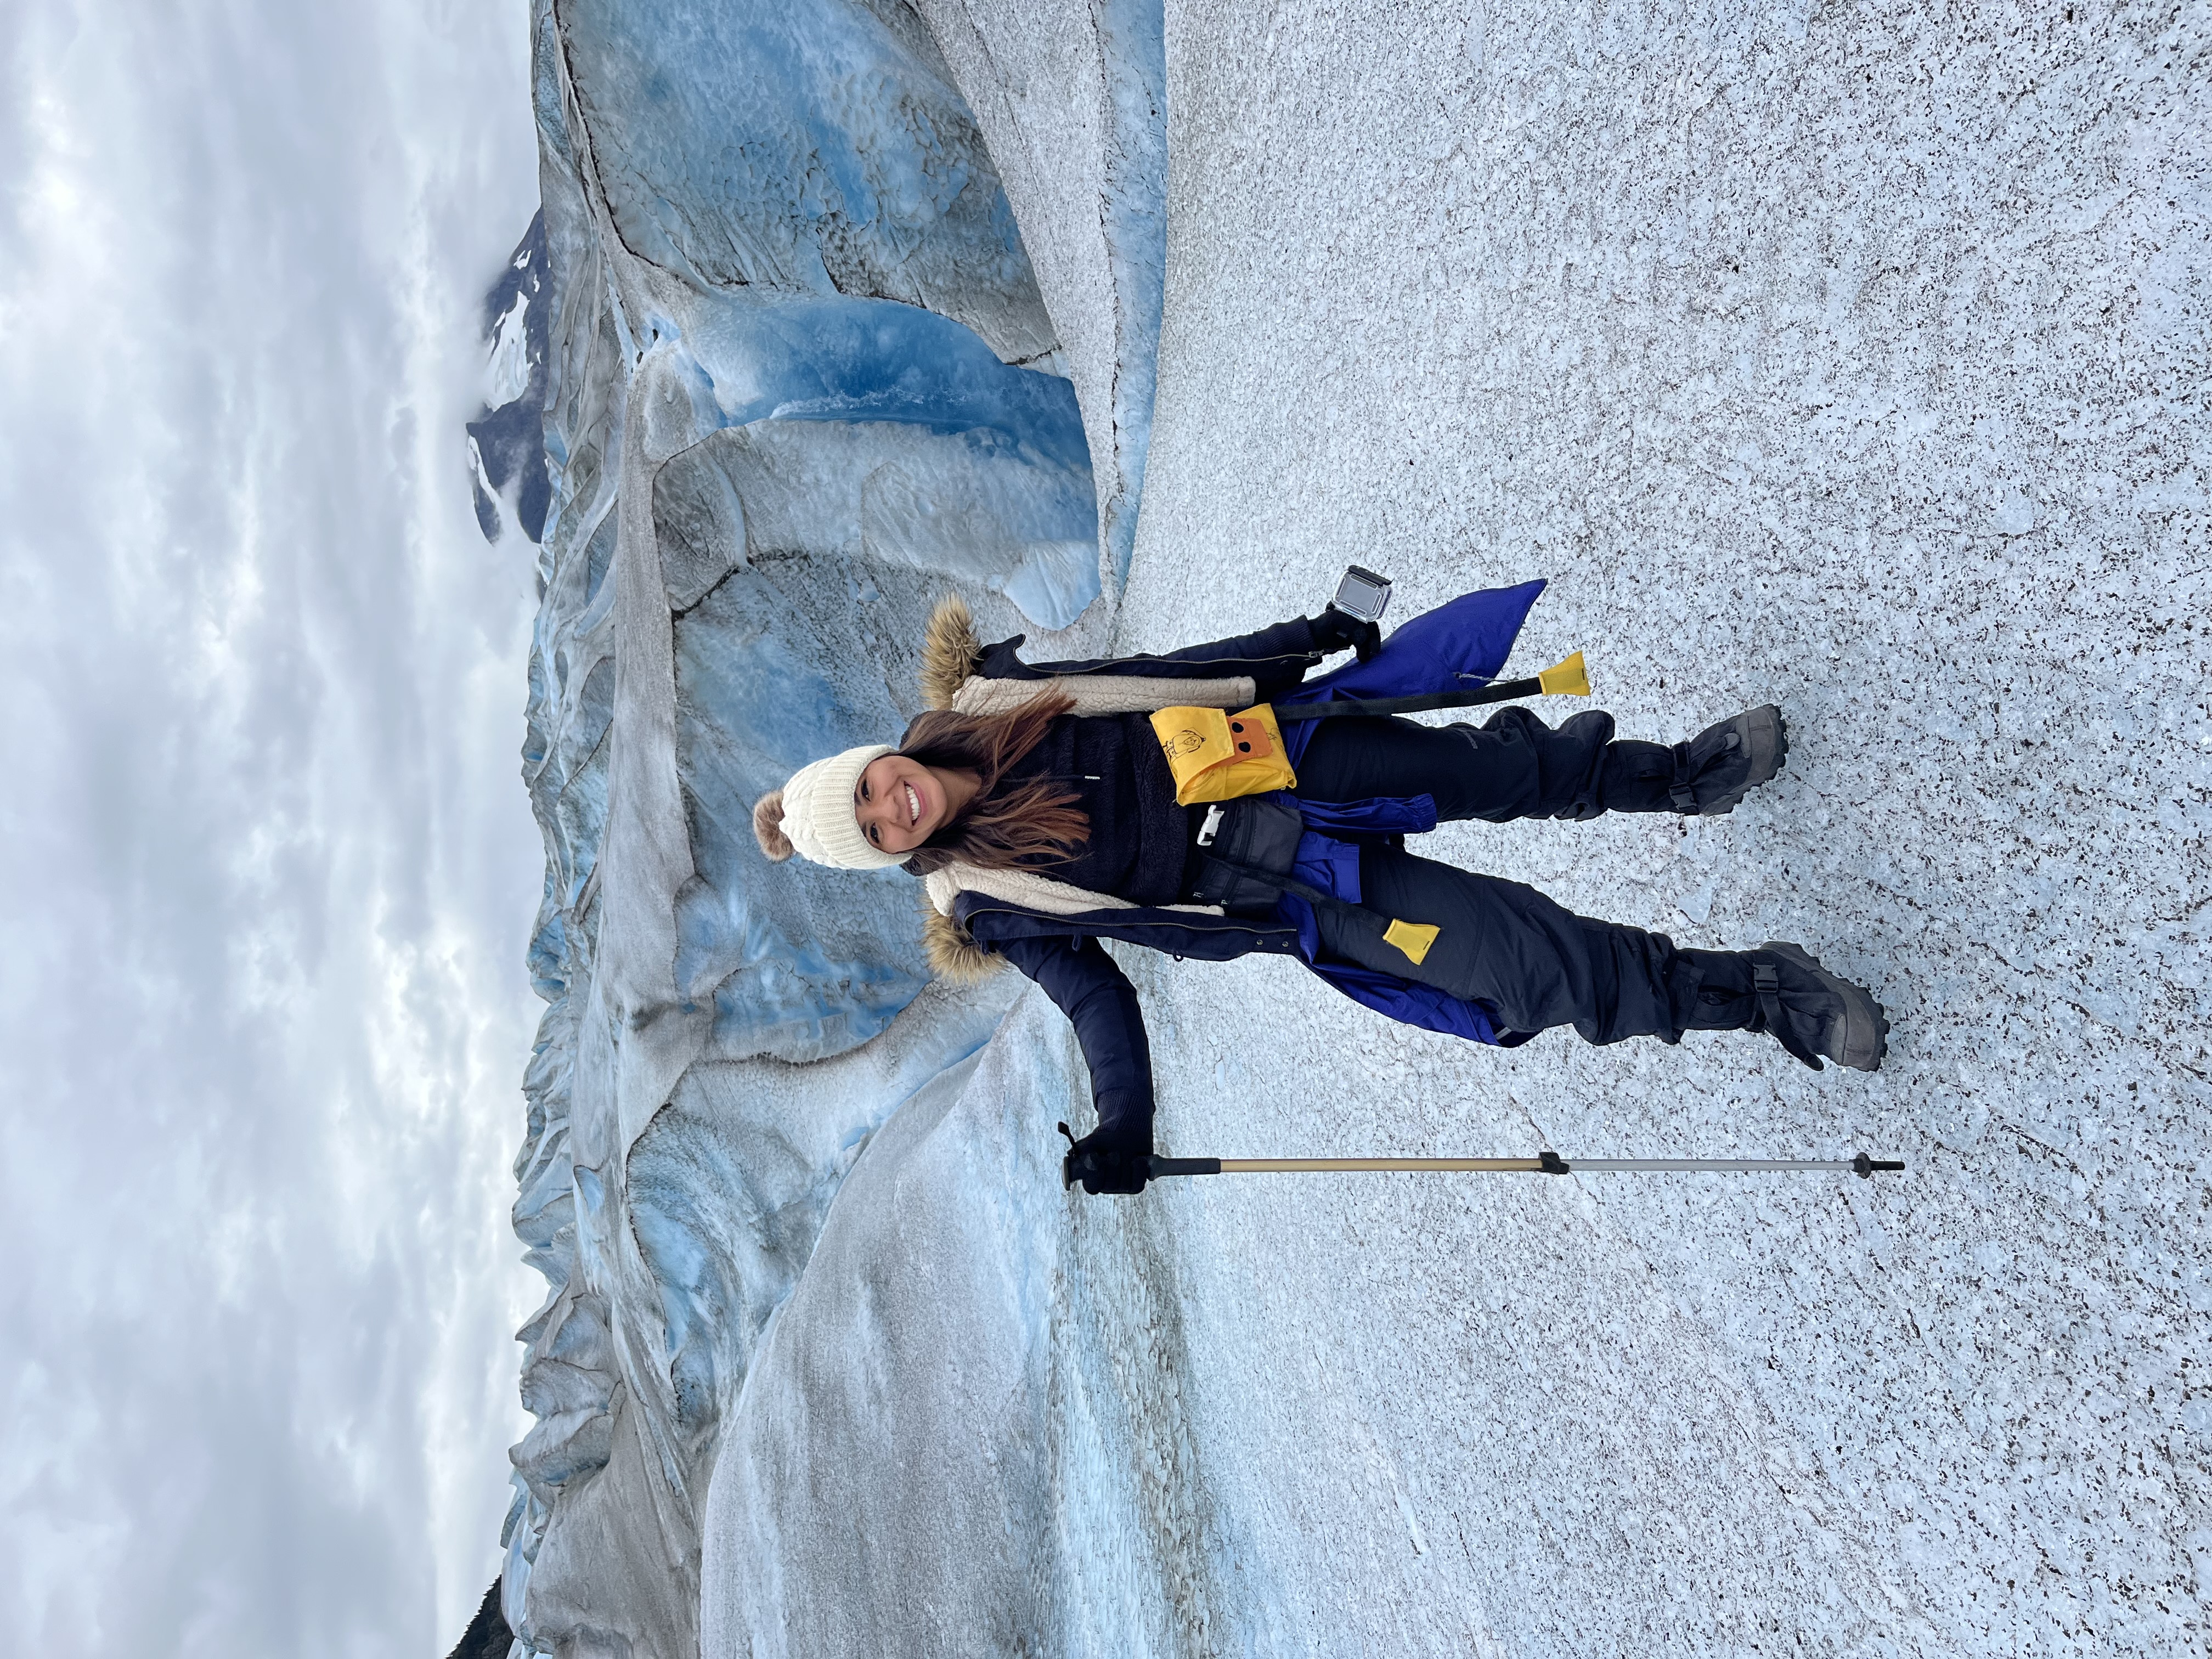
My hobbies include airports and poor sleep schedules.
No jokes this time.
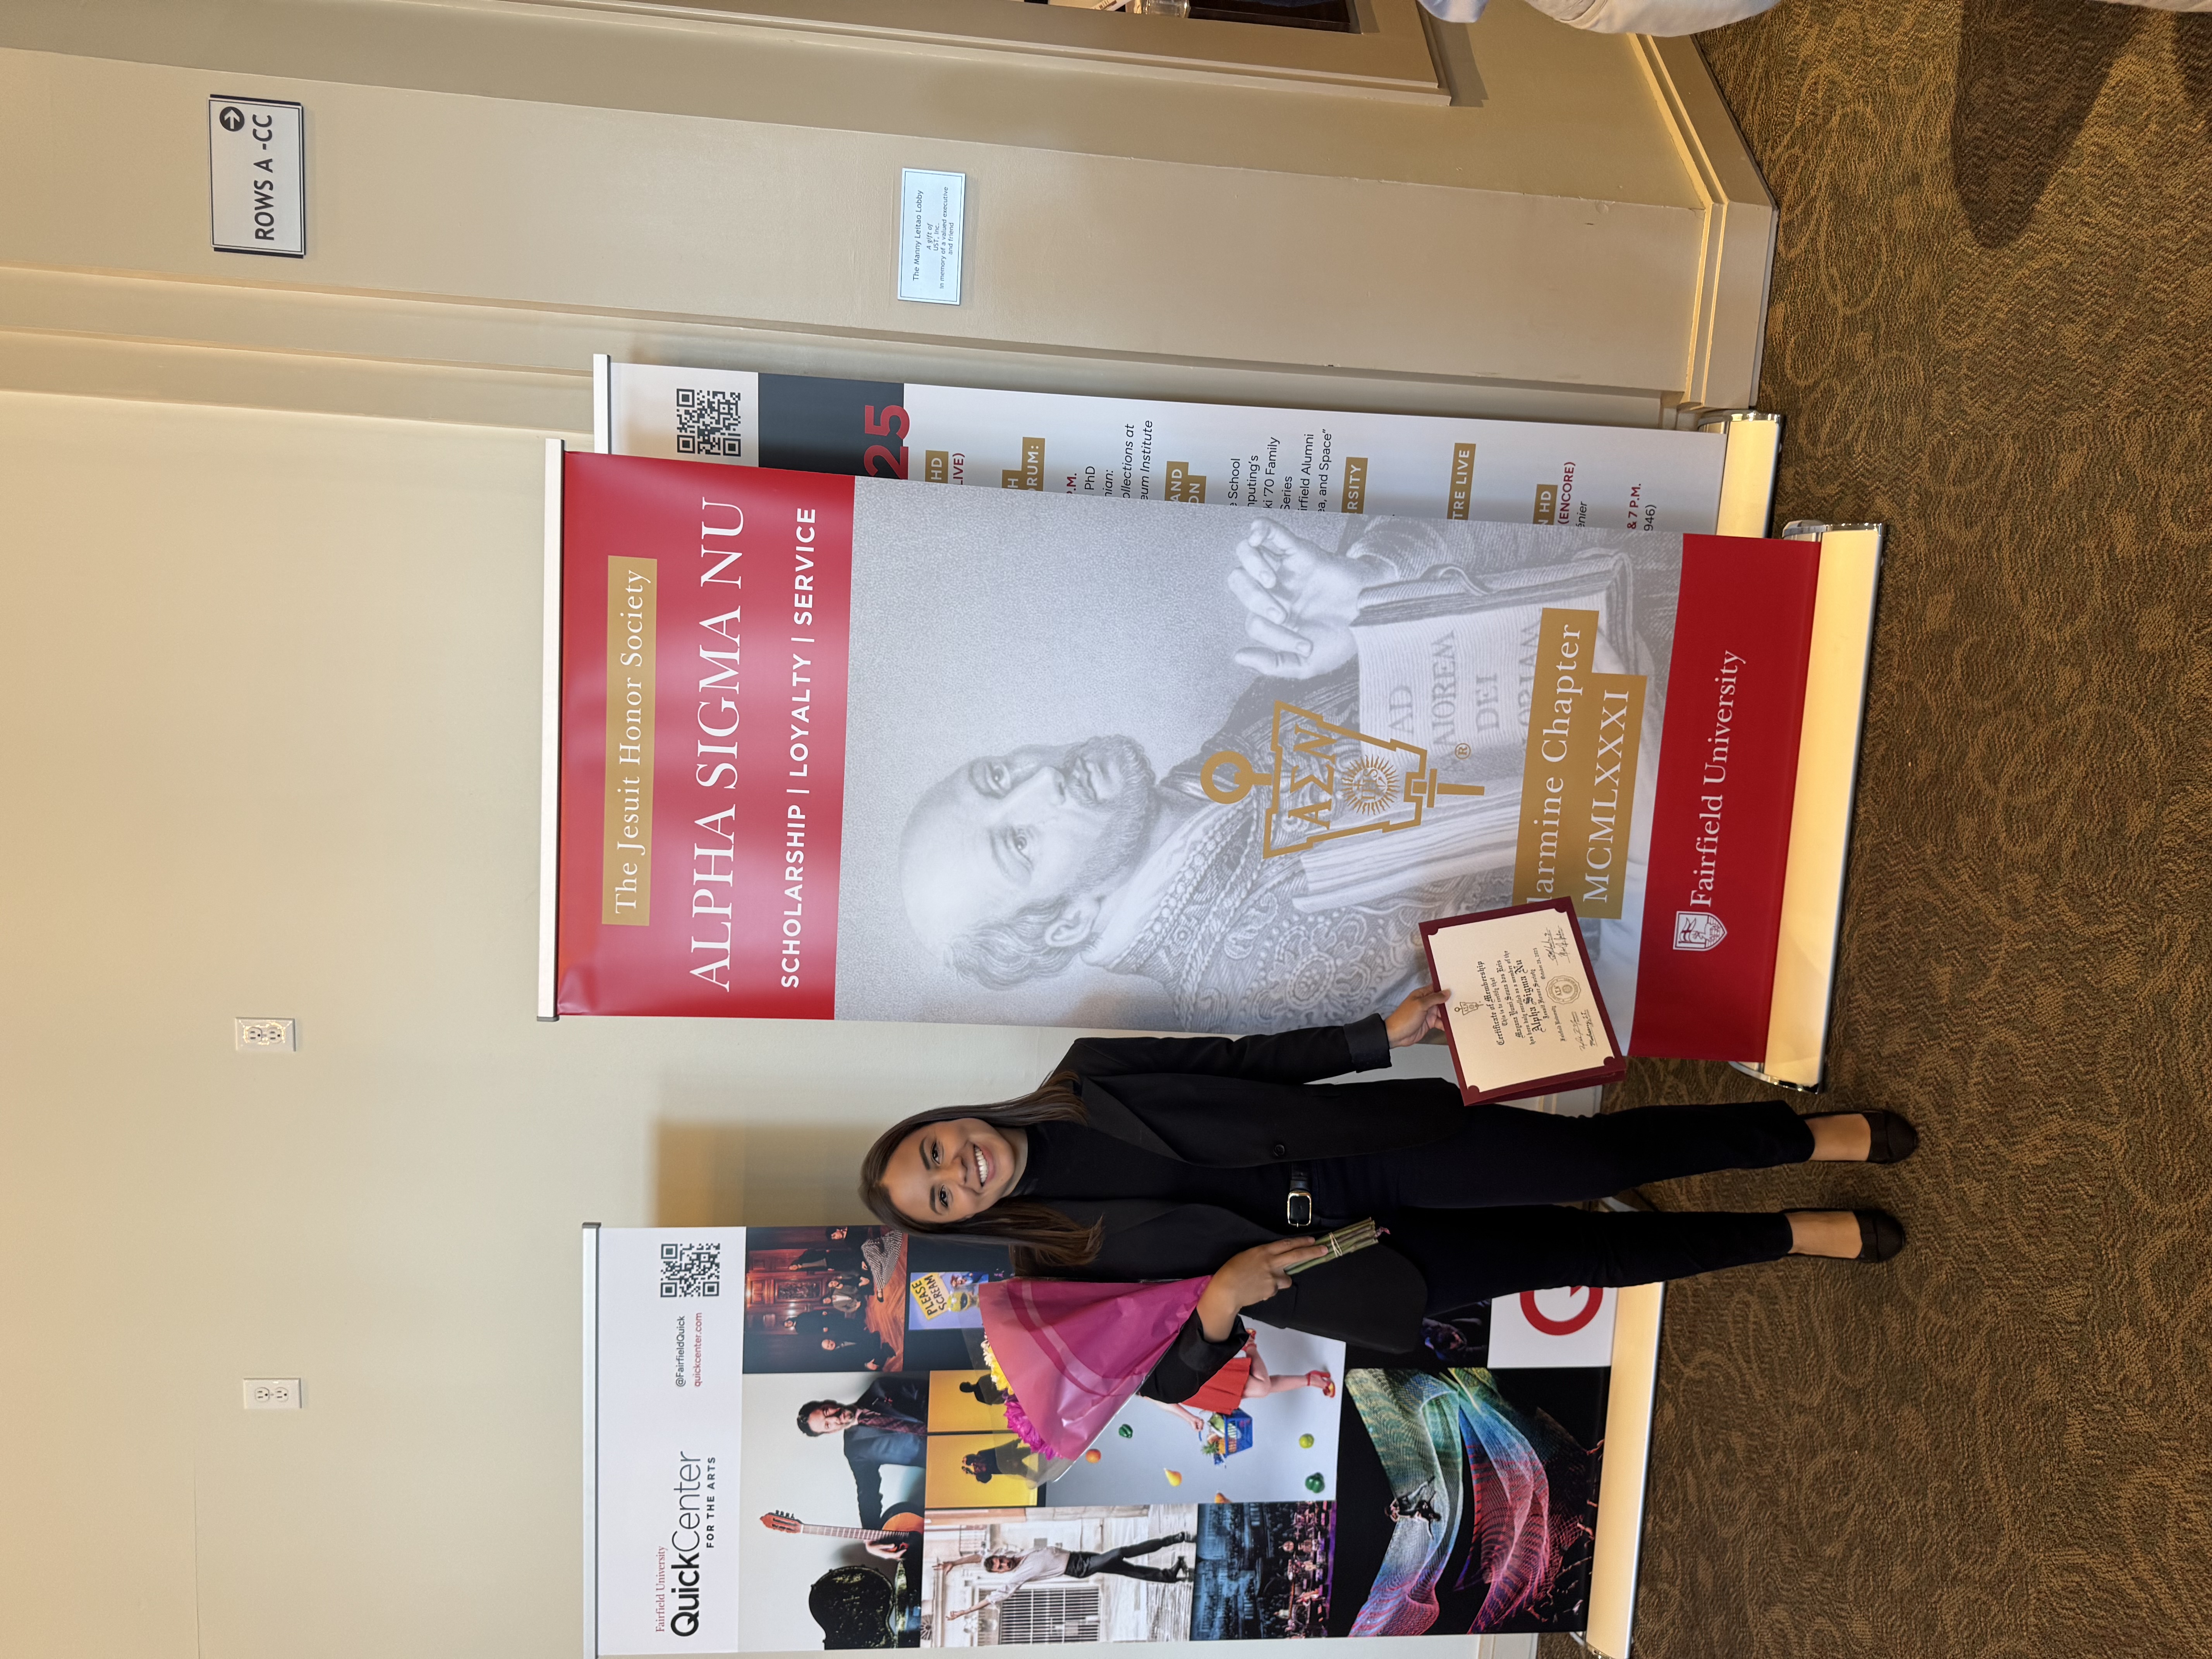
Apparently that qualifies me for honor societies.
Strengths
Toolkit
Journey
2026
Everyone is invited
Save the date.
2026
Synchrony Financial
Assisted in collecting and analyzing media data from social media platforms, programmatic DSPs, search, affiliate, and other digital media channels.
2025
BMW Group US Headquarters
Queried and analyzed internal datasets using SQL to deliver business intelligence and performance insights supporting Marketing initiatives.
2024
Fairfield University (Connecticut, USA)
Master of Science in Marketing Analytics and Strategy and Master of Business Administration (MBA) — Business Analytics Concentration.
2022
Exchange Program
Moved to the USA on an exchange program to learn English and live another culture.
2021
University of Sao Paulo (Brazil)
Graduated from the best university in Latin America. Focused on Advertising.
2016 — 2020
Various Companies & Industries
Worked across a range of companies and different industries, building a broad foundation of skills and perspectives.
Have a messy idea, a structured problem, or something in between?
I'm here for all of it.
Strategy meets data. Creativity meets analytics.